During this first week of lectures, I was able to listen and internalize some powerful ideas from Aza Raskin, Burt Herman and Amanda Cox. These ideas are simple but contains powerful concepts that I believe that will help me to refine my project for the Knight-Mozilla Learning Lab.
Prototyping: Basically, Aza Raskin told us about the importance of prototypes and how they are a key tool in the process to transmit and idea. Fact that is very common for people with engineering background, likes me, but Aza takes this concept to a deep level, defining levels of communication from a simple written idea to a video demonstration, as the richest way to transmit the idea.
Creating: Before Burt Herman presentation, I didn’t know anything about Storify. The concept is a tool that let people create and share stories using photos, tweets, among others resources. However, listening to Burt about his personal experience during the conception to implementation phases; it gives many ideas about the importance of the team and the importance of be flexible and listen the users, because the user experience becomes a key factor for the success in any idea.
Visualizing: I also have the opportunity of listen Amanda Cox experience about how design and create powerful visualizations; which are really important to help readers to understand high amounts of data. One idea that caught my attention is giving to possibility to users to interact and “play” with the infographic/visualization, feature that is extremely attractive in order to let the people produce and share their own information.
Finally, as a software developer, my experience is more given to build something. I think about how include these ideas in my project, and I just came with this new idea:
The idea is to create a tool that helps journalists to organize and manage information and comments during the writing and after publish the news, it helps readers to understand and collaborate with the discussion or sharing additional relevant information.
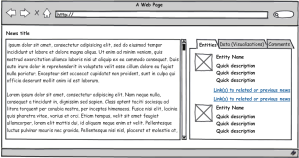
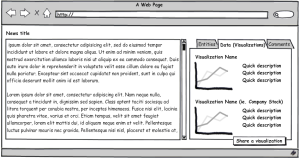
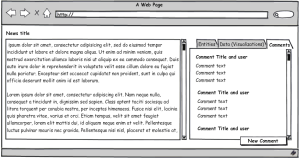
This is a mockup of the idea:
At this moment, the idea includes four features:
1. Entities: Using part of my first prototype, the news content will be semantic processed, in order to extract entities (people, organizations, etc) related with the news, using this feature, both journalist and reader will have the option to get a more information or access related news for each entity.
2. Data (Visualization): In the second tab, the journalist will be able to add data that support or gives more detail about a news. For example, stocks price chart or any visualization. The idea is that users can play with this information. (I’m also thinking in a mechanism to allow users to contribute with data/visualization from standard/credible sources).
3. Comments: In the third tab, the user will be able read and share comments, using a similar scheme to the original prototype in which users will be able to filter comments related with an specific entity.
Additional ideas to consider:
- The option to let users interact with the text, for example, if I click in the entity name, and only will receive entities, data and comments about that specific entity (to avoid to giving too much information to readers).
- Explore other kind of information/tabs that users will find interesting/relevant.
Finally, the tool has the advantage that it will generate automatically information for journalists and it will have the option to generate a widget (which can be included with published news) in order to let users gather more information and contribute with more facts and options about a news.


I think there’s a lot of potential here, but you seem to be going for everything but the kitchen sink.
On the one hand it’s a note-taking app, but on the other hand it sounds a lot like you’re creating a new CMS. It’s mainly a back-end tool… but you also want to have user-facing widgets. And visualizations. And crowdsourcing.
Also, you can do cool stuff with entity extraction, but I’m actually not sure your tool calls for it. As a journalist, if I’m writing a piece about certain persons, you can be pretty sure that I know a whole lot about who they are and what they do, and presenting me with a link to a Wikipedia page or web search for these people does absolutely nothing for me.
So, if you’d have to describe your tool in one sentence, what would it be?
Pingback: Grazie Cody Shotwell for the Post! MediaShift Idea Lab . Prototypes, Visualizations Take Shape in Knight-Mozilla Learning Lab | PBS « Transmedia Camp 101